
3-2-1 Contact: Comparing MD simulations with diffuse data
Overview
Overview
This post describes the first systematic comparisons between molecular dynamics (MD)–derived diffuse scattering and experimental measurements on the diffUSE project. These early analyses establish a baseline for evaluating how well MD simulations reproduce the observed isotropic and anisotropic features of the data. They also suggest possible improvements in the way we compare MD simulations to diffuse data.
Initial Comparisons
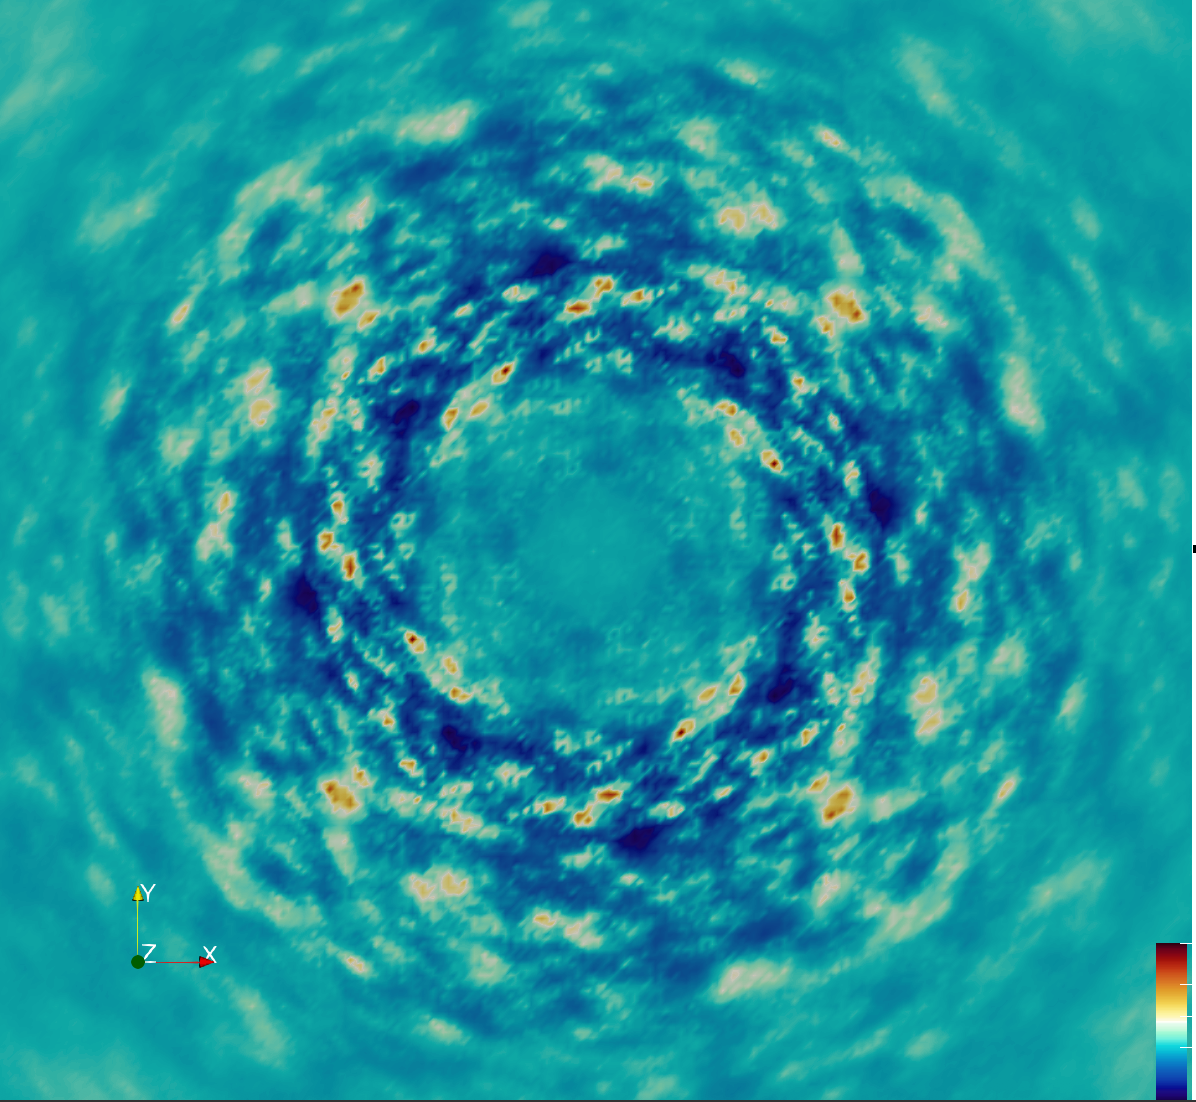
Data from the first diffUSE experiments were used for comparisons (see Getting our feet wet post). The H8 dataset was used, which was obtained using a medium radiation dose (see preliminary analysis of the diffuse scattering).
The H8 dataset was originally sampled on a grid using 2×2×4 points per integer hkl value. To align with the 2x2x2 supercell MD simulation output, it was resampled onto a 2×2×2 grid for direct comparison.
This initial processing yielded a correlation with the MD simulation of 0.88 for the total diffuse intensity, and a correlation of 0.32 for just the anisotropic component.
Refinement and Improvements
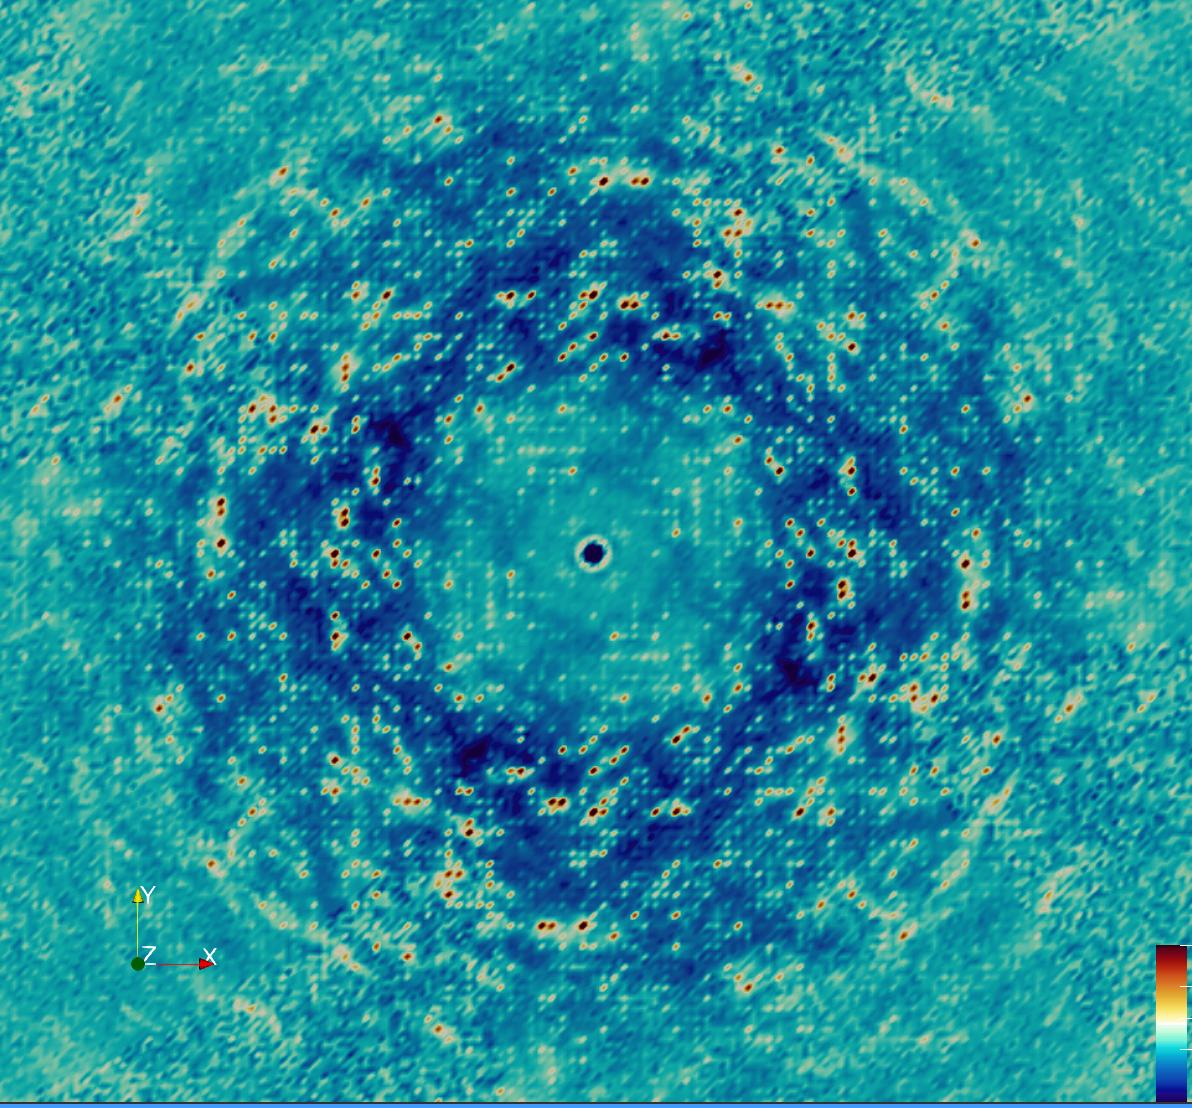
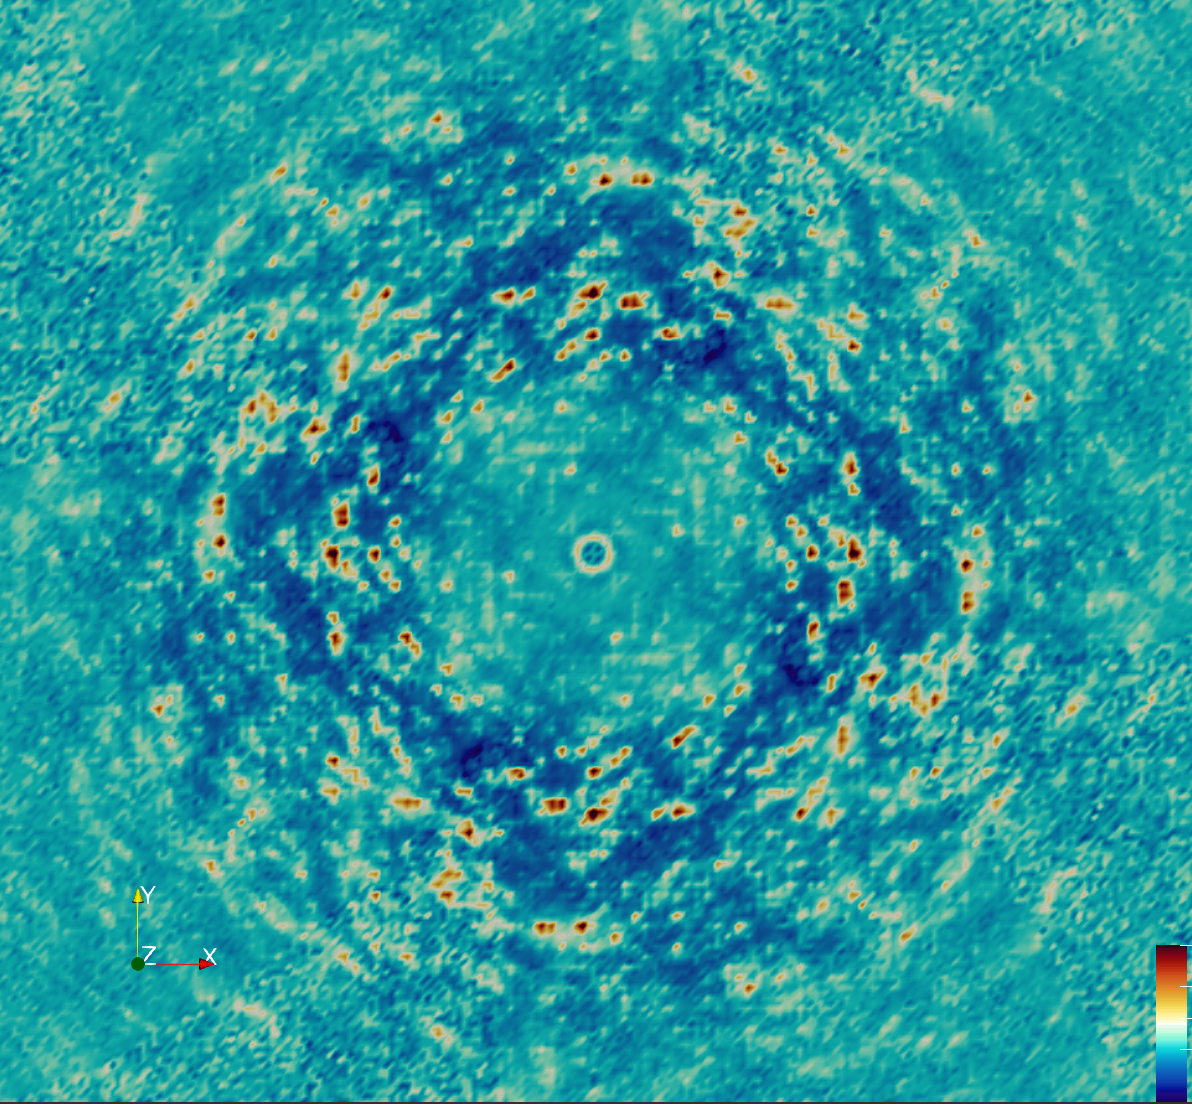
The MD simulations were performed using 2x2x2 supercell, which is too small to include contributions from long-range correlations in the lattice. We therefore wondered whether the agreement of the MD with the diffuse data might be diminished in the immediate neighborhood of the Bragg peak, which is associated with lattice vibrations (GOODVIBES is specifically designed to accurately model this part of the signal). We also noticed certain outlier intensity values in the data (specifically, negative values), and wished to avoid using those in comparisons.
Another round of data processing was performed considering these ideas. First, Steve re-processed the diffraction images, sampling more finely onto a 4x4x4 grid. The intensities at integer hkl, correspinding to the immediate neighborhood of the Bragg peaks, were then masked out prior to downsampling to 2x2x2. Negative intensities were additionally masked out.
The revised processing improved the agreement with the MD substantially:
- Total correlation: 0.96
- Anisotropic correlation: 0.56
Outlook
We now have our first assessment of the agreement of MD simulations with diffuse data collected on the diffUSE project. This is our baseline for improving the MD models. We also identified specific regions of the diffuse map – close to the Bragg peaks – where the MD might be currently lacking. These regions of the model might be improved by using a larger supercell for the MD.
This post was initially drafted in ChatGPT based on a Slack exchange between Steve Meisburger and Michael Wall, and was rewritten and posted by Michael Wall on October 20, 2025.