
Water analysis
A cartoon representation of a protein structure in an empty background easily makes one forget about the physical presence of numerous water molecules around the protein and their significance. In fact, a major driving force of protein folding comes from entropic changes from the water molecules surrounding the protein. When taking measurements of protein structures, solvent inevitably contributes, and it can contribute substantially to the experimental data. Consequently, protein structural refinement refines both the protein and its experimental context, including the solvent.
On the DiffUSE project, we have been thinking about solvent modeling and major hurdles that need to be overcome as we model protein ensembles (see our previous all hands post for more context). In this post, I hope to initiate discussions on why water prediction is hard with some preliminary analysis. In particular, is there something about the deposited data that makes them difficult to learn by data-driven approaches?
How is water modeled?
In crystallography, solvent modeling is simplified as either ordered or bulk. Bulk solvent represents disordered water molecules with a flat density. Ordered solvent molecules form hydrogen bonds with the protein and/or other solvent and are represented with atomic coordinates. They have attracted much research interest as some ordered water molecules can be conserved across protein families and participate in or influence chemical reactions. Several machine learning approaches, such as SuperWater, HydroProt, and GalaxyWater-CNN attempted to learn directly from the PDB on placing ordered water around proteins. While protein structure predictors trained on the PDB have achieved impressive results, existing water predictors are still not at the same level of out-of-the box performance.
Unlike for proteins, validation procedures are not enforced for the deposition of ordered water in the PDB. Wlodawer et al. analyzed the expected ratio of the number of ordered waters to the number of residues in PDB as a function of the resolution (check out their interactive figure), and found many structures with an unusual number of water molecules modeled, including some completely waterless structures on which the authors did in-depth examination. Realistically, especially in high-resolution structures, only a small subset of ordered waters might be near an active site and are interesting or important enough for the depositor to carefully inspect.
For a scalable approach to model ordered water, established refinement programs have built automated protocols. For example, PDB-REDO re-refines structures at scale with the removal of water molecules that are unsupported by the density. Density-based automated protocols, however, are not perfect, as they are subjected to phase errors. Other heuristics are often used as an auxiliary to model as well as evaluate the individual ordered water molecules. The distance and the number of hydrogen bonds suggest how physically plausible the ordered water is, and the B-factor and density-based metrics such as EDIA show how well the water molecules fit to experimental data.
What do the water data look like?
It is unclear how effective the auto-refinement and popular quality metrics are in providing “clean” data from the perspective of statistical learning. Consider each individual PDB file as containing some water molecules that are true positives, some that are false positives, and some water molecules are missing, how good is a PDB file as an instance of prediction? One way to explore this analysis is by examining conserved waters as a surrogate of the ground truth that can be reliably evaluated against. Our motivation is that the water molecules that consistently show up are the ones we want to predict and are probably more learnable.
For the consensus analysis, I gather isomorphous structures from PDB-REDO for 3 protein cases – 66 structures of hen egg white lysozyme (HEWL), 18 structures of beta-lactamase (TEM1), and 60 structures of protein tyrosine phosphatase 1B (PTP1B) – and cluster the ordered waters with a 1Å distance cutoff after alignment. Water molecules that show up in more than half of the structures (i.e. cluster occupancy >= 0.5) are considered as conserved.
Precision-coverage tradeoff as a function of the number of water
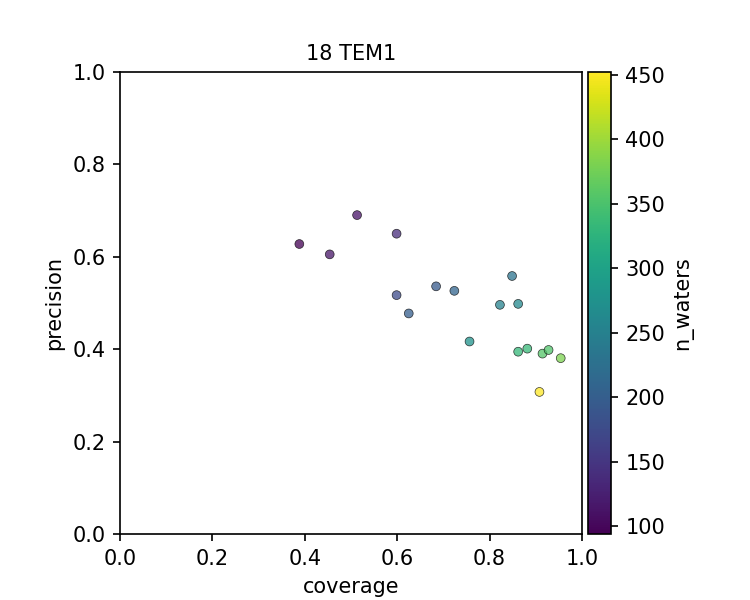
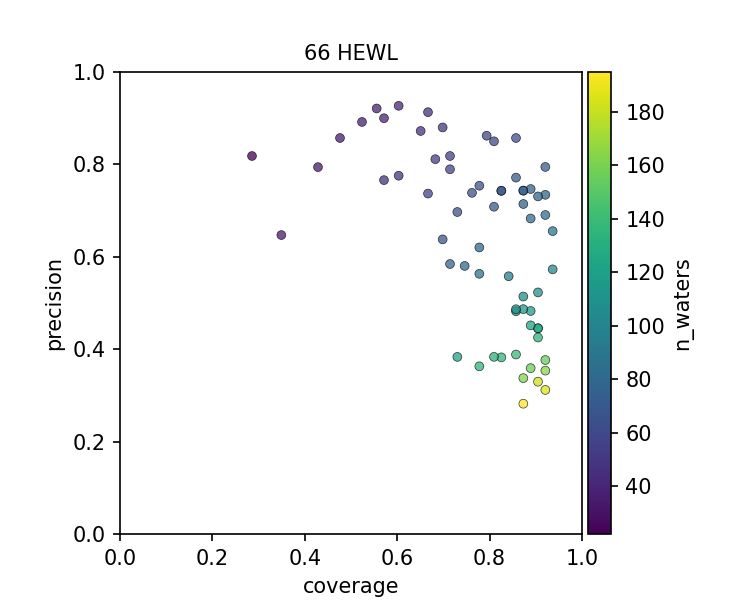
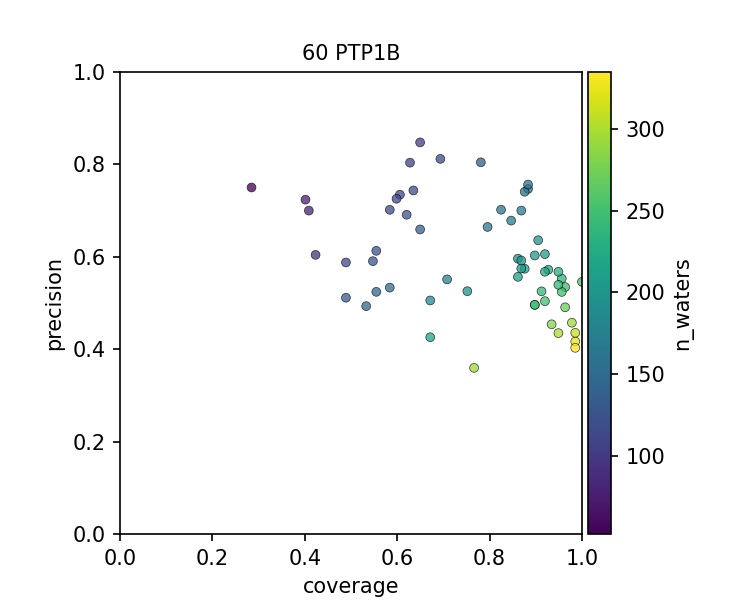
The figures above show that there is a spectrum of how well each PDB file models the set of conserved water when considering a PDB file as an instance of prediction. In all 3 cases, there is a precision-coverage tradeoff with the number of water molecules modeled, which is highly correlated to the resolution of the structure.
High-resolution structures resolve more ordered water molecules and have a good coverage of the conserved water. Low-resolution structures, however, also contain useful information, as they can be quite precise on capturing the conserved waters. In other words, even though some structures have fewer ordered waters resolved, presumably, the ones that can still be modeled have high confidence. The frontier of the precision-coverage tradeoff, however, varies case by case.
Consensus water is a subset of the high quality water
Given the high coverage of conserved water in high resolution structures, one might wonder if we can deploy some filtering to improve the precision of water placement. To this end, I made a scatter plot of the water conservedness against quality metrics. Conservedness is defined as cluster occupancy, which is the fraction of PDB files that has a water molecule near the cluster center.
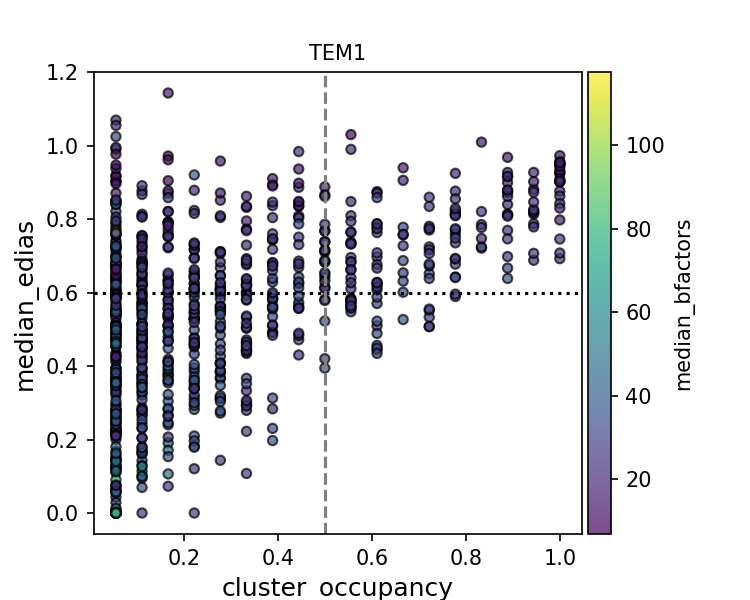
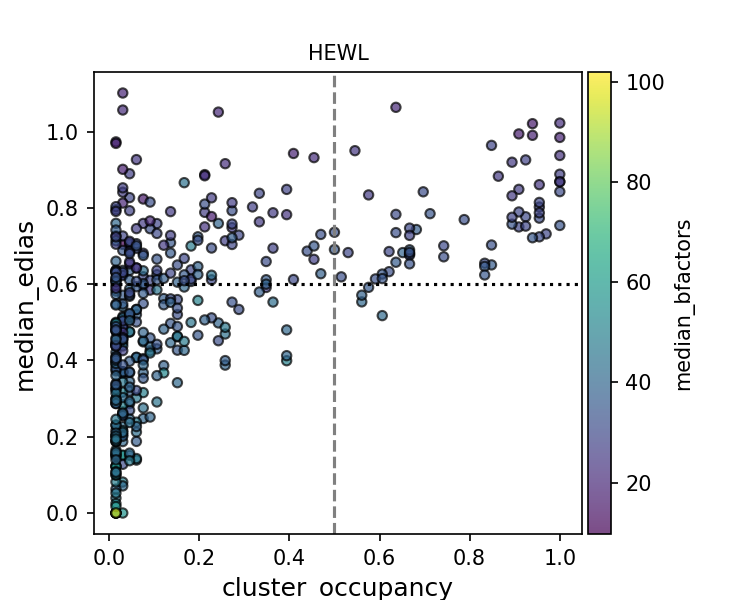
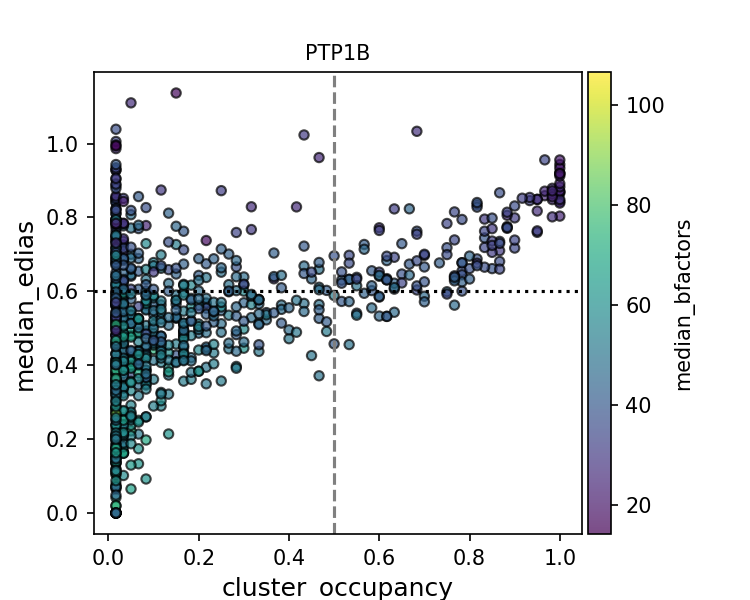
While there is a positive relationship between high EDIA (or low B-factor) and cluster occupancy, clusters in the upper left corner suggest that there are some water molecules that are high-quality but not conserved. They might be unique waters specific to certain experimental contexts (crystallization condition, presence of ligands, protonation states, etc.). Alternatively, waters at those cluster positions might be missing in some structures due to limited resolution, experimental errors, and modeling errors of water as well as protein (e.g. alternative conformations). This makes interpreting the precision evaluation metric especially challenging.
What should we do about water?
The consensus water analysis here gives a glimpse into the complexity of the data challenges we have on water prediction. Between the true positives and overfitted noises, there are ordered waters in PDB that are hard to validate, let alone to learn. While it is common practice to align and compare related protein structures, similar inspection for water is much rarer and limited to a few case studies. We think it is worth expanding the consensus analysis at scale for more generalizable insights, including identifying potential sources of biases such as the initial model used and depositor preferences.
We understand that consensus water is not equal to the ground truth water, and physical factors on an apparently small or local scale like an alternative conformation of a protein side chain can change the structure of water networks. Predicting water positions from just the protein structure is strictly speaking an ill-posed task. That said, one could still try to learn a statistical prior for experimental guidance as Bayesian refinement, in similar spirit of Sampleworks. We are building a water predictor for this purpose, and stay tuned for Vratin’s post about this!
Echoing discussion points in Wlodawer et al., we hope the structural community can work together on the water modeling challenge – whether it’s increasing awareness at the individual depositor level, exploration of new computational modeling methods and evaluation metrics, or infrastructure-level support in the PDB.