
Revealing hidden signals in raw X-ray crystallography data with mdx2
Proteins are dynamic, even when packed in a crystal lattice. The dynamics leave an imprint in the raw X-ray crystallography data in the form of diffuse scattering, which encodes information about correlated atomic motions in the protein. Although measuring correlated motions is the key to many frontier questions in biochemistry1, we haven’t yet been able to make routine use of diffuse scattering signal. One reason is that conventional data processing tools discard the diffuse scattering as “background” at an early stage, and as a result crystallographers may not even be aware that it exists.
What if diffuse scattering data were carried through all steps in data processing and model refinement? What new science would that enable?
Let’s find out! One key step toward this goal is to make diffuse data processing easier. In this post, I’ll introduce our open-source toolkit mdx2, and explain why I think it will change the way structural biologists use X-ray data.
What makes diffuse data tricky to process?
The main task of data processing is to map detector pixels and their intensities into three-dimensional (3-D) reciprocal space, and then to merge and scale photon counts in order to generate a 3-D map of diffuse intensity (Figure 1).
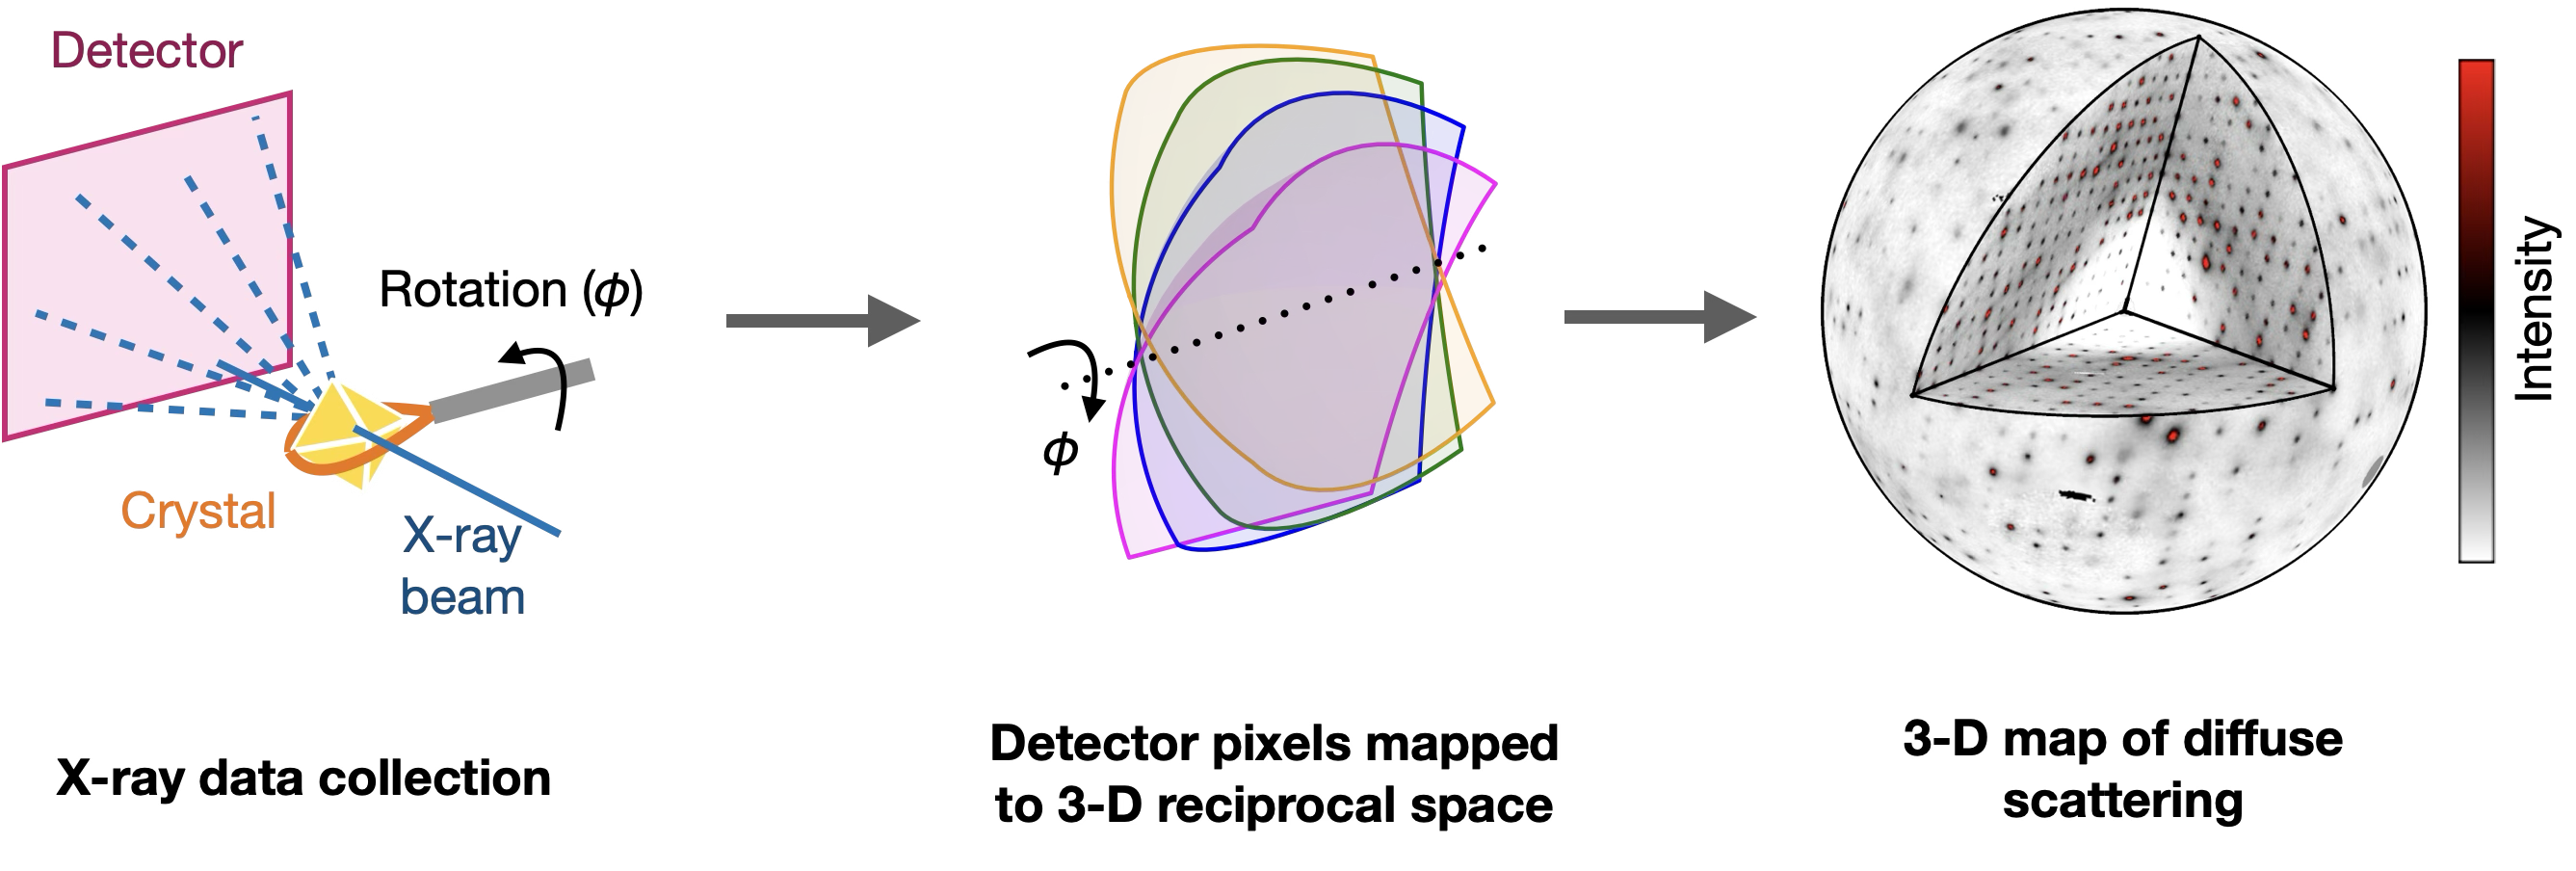
Figure 1. Diffuse data processing can be divided conceptually into two steps: mapping signals from the detector to reciprocal space, and merging them to produce a final three-dimensional (3-D) map. Adapted from Meisburger & Ando (2024).2
In the first step, the precise orientations of the crystal, detector, and X-ray beam are determined, and the photon counts are corrected for various non-ideal effects. Thankfully, this first step is shared with conventional crystallography, and the algorithms have already been worked out. The second step, scaling and merging, requires a different approach because Bragg diffraction and diffuse scattering differ in a few key ways.3
- The diffuse scattering is a continuous signal requiring discretization into reciprocal space coordinates (H, K, L can take any value, not just integers). To fully describe sharp diffuse features like halos, the diffuse map is typically oversampled relative to the reciprocal lattice. Multiple passes of data processing are performed, first producing a coarse map to refine corrections, and then a final, finely sampled map.
- Diffuse scattering is everywhere on the detector and mixed with the background from the experimental apparatus, requiring a separate background dataset measured with the crystal out of the X-ray beam.
- The diffuse signal is very weak compared with the Bragg peaks, with most detector pixels recording zero counts, so algorithms must be robust to count-limited data and carefully designed to avoid artifacts when merging many signals together.
What is Mdx2?
Mdx2 is an open-source toolkit for diffuse data processing written in Python. Mdx2 is built on top of DIALS, an open-source project for conventional crystallography data processing. Mdx2 modules can be imported to access the data as familiar Python objects, or its command-line tools can be run with a DIALS-like syntax
Mdx2 began as a teaching tool for the 2022 International School of Crystallography in Erice, Italy.4 Subsequently, the Ando lab’s state-of-the-art scaling and merging algorithms3 from the MATLAB-based mdx-lib were incorporated.2 When we began the Diffuse Project last year, it was clear that mdx2 would be the right choice for data processing, since it is open source and easy to use. However, because it was so new, several key features from mdx-lib were still missing, and it had only been tested on a handful of datasets.
Where we’re at
Over the past year, teams at Cornell and UCSF collected hundreds of diffuse scattering datasets over sixteen synchrotron visits (documented online in the logbook). As the teams worked together to process data, sticking points became clear very quickly, and these were addressed through improvements to the code. Here we highlight several major updates.
Reproducible computing. Mdx2 is now packaged on conda-forge. Install the latest version and its dependencies using mamba install -c conda-forge mdx2.
Automated reports. Since version 1.0.4, mdx2 can produce data visualizations, validation statistics, and other plots via the mdx2.report command-line tool. This tool generates Jupyter notebooks from built-in templates and executes them automatically in the mdx2 environment (Figure 2).
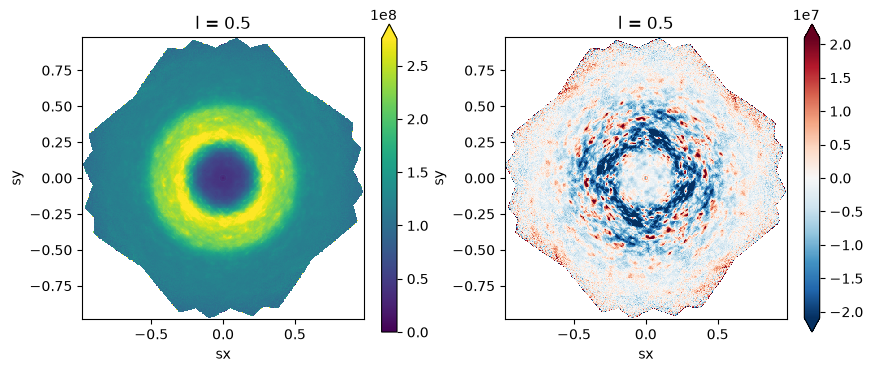
Figure 2. Example output generated by mdx2.report. The figure, selected from the visualization.ipynb report notebook, shows a slice through the diffuse map of SARS-CoV-2 macrodomain (mac1) crystallized in the P43 space group. Slices are perpendicular to the L direction (the four-fold symmetry axis). The image on the left is the total intensity, which includes scattering from the disordered solvent within the crystal. In the image on the right, the isotropic scattering has been removed to better visualize the fluctuating pattern.
Fine map generation. mdx2.reintegrate implements the final step in data processing, after corrections are refined, to generate finely sampled diffuse maps (Figure 3).
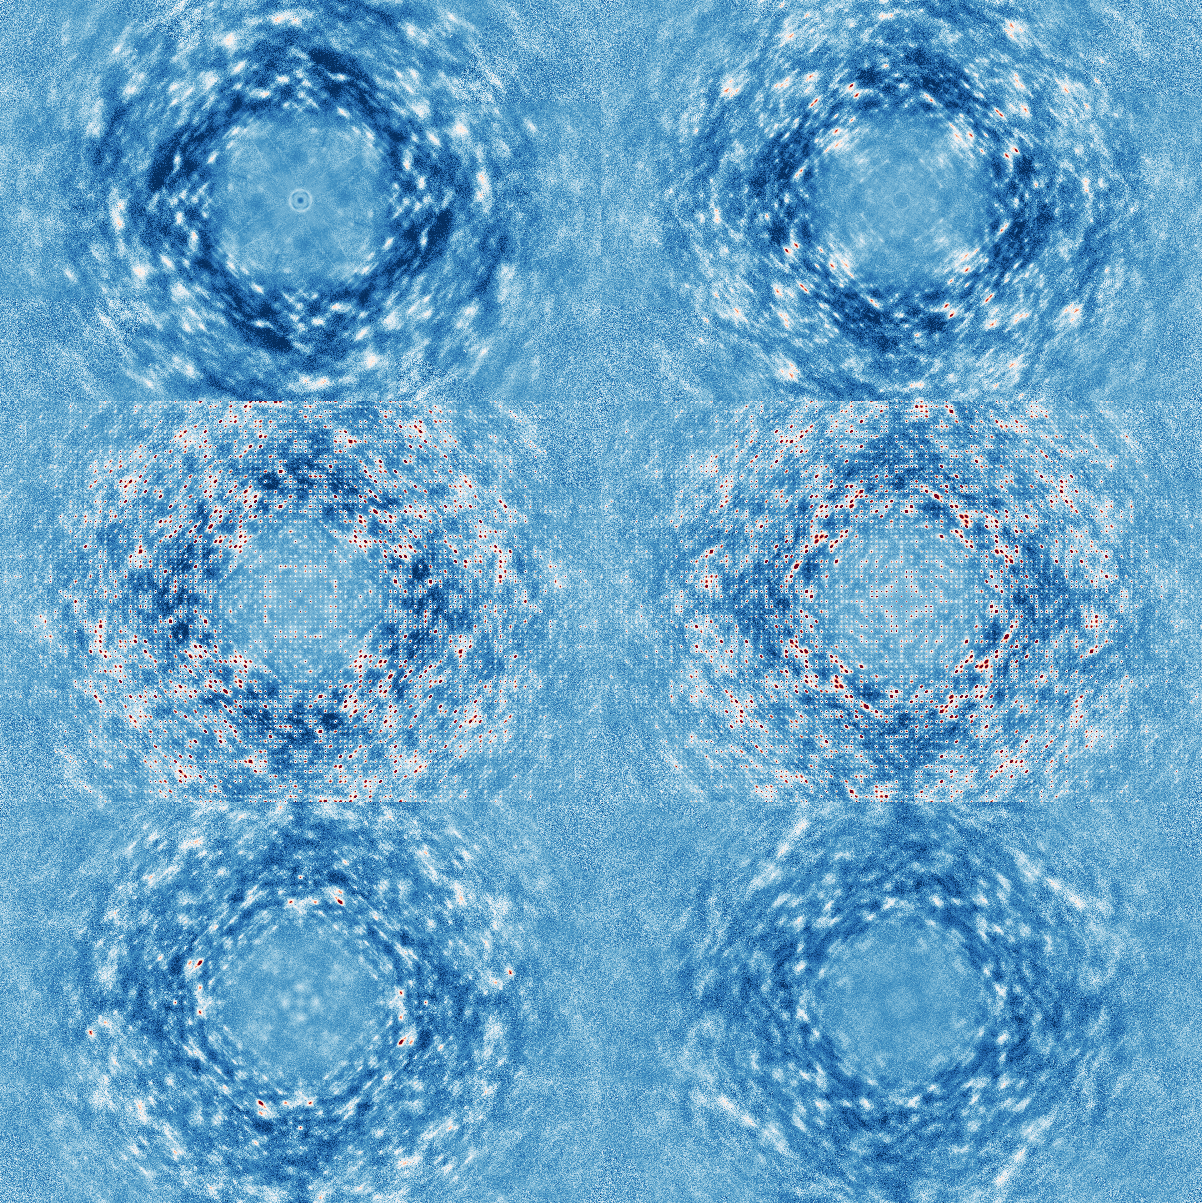
Figure 3. Slices through a finely sampled 3-D diffuse map (same dataset as Figure 2). The scattering was mapped on a 5 x 5 x 11 oversampled grid (H x K x L, relative to the reciprocal lattice) using mdx2.reintegrate. Slices are perpendicular to the L direction. A lattice of intense peaks (red in the color map) appears whenever L is an integer – these are the diffuse halos (Bragg peaks have been removed).
What’s next
Now that mdx2 has been refined through many cycles of data collection, we are turning our attention toward increased automation. We are targeting two applications:
- Providing timely feedback during data collection, which would enable experimenters to make decisions informed by diffuse scattering.
- Batch re-processing accumulated data from the project, for instance when a new algorithm is added to mdx2.
We are keen for others to try mdx2, and we welcome contributions to the project. Tutorials and source code are available at github.com/diff-use/mdx2.
References
-
Xu, D., Meisburger, S. P., & Ando, N. (2021). Correlated Motions in Structural Biology. Biochemistry, 60(30), 2331–2340. doi.org/10.1021/acs.biochem.1c00420 ↩
-
Meisburger, S. P., & Ando, N. (2024). Scaling and merging macromolecular diffuse scattering with mdx2. Acta crystallographica. Section D, Structural biology, 80(Pt 5), 299–313. doi.org/10.1107/S2059798324002705 ↩ ↩2
-
Meisburger, S. P., Case, D. A., & Ando, N. (2020). Diffuse X-ray scattering from correlated motions in a protein crystal. Nature communications, 11(1), 1271. doi.org/10.1038/s41467-020-14933-6 ↩ ↩2
-
Meisburger, S. P., & Ando, N. (2023). Processing macromolecular diffuse scattering data. Methods in enzymology, 688, 43–86. doi.org/10.1016/bs.mie.2023.06.010 ↩
Comments